When you are managing 100s of physical servers across 12 data centers across the country and when developers are hitting your API more than 20 million times in a day, you will need tools to help you out.
We use a lot of tools to monitor KooKoo and Cloudagent and the following is a list of some of the tools we use. Hope others will find the list helpful in their own monitoring needs. These are very common tools and nothing extraordinary, but they get the job done :)
1. Nagios: The most important tool. We have created more than 20 custom plugins to monitor our custom telephony infrastructure.
2. Munin: Has been invaluable in helping us identify resource usage especially when some rouge processes started hogging up the resources.
3. Snort: Has been responsible for identifying attacks in our networks.
4. Monit: Monitors all our main processes and brings them up automatically when they go down.
5. Linux commands: top, htop, ntop, ps, iostat, pmap, netstat, wireshark, ngrep, traceroute etc
6. Apachetop: A small tool to monitor our web servers.
7. RRDtool: For monitoring time series data.
In addition to these tools, we have hacked together more than 30 small Perl scripts which do a lot of clean up and monitoring activities.
We also have 5 web applications which collect timing data, log information, error information etc and display them graphically.
We hope to release these scripts sometime soon on Github.
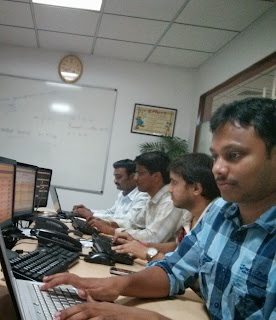
And if all these scripts and tools fail, we have the most important failsafe, people.
We always have system engineers monitoring different parts of the system 24/7 365 days of the year.
